This week’s huge protests in Israel drew huge crowds to the streets – but how many people took part? Crowd sizes are often used as evidence to show how widely supported a particular cause is, so being able to determine how many people took part in a demonstration is an important skill for those working in verification.
Fortunately counting crowds in public spaces has been made easier than ever before by the creators of MapChecking. It is powered by Google Maps and allows researchers to plot a geographic area and then calculate the number of people that could fit in that space. There are three simple steps to follow:
1. Find the location.
2. Define the count area.
3. Calculate the crowd density.
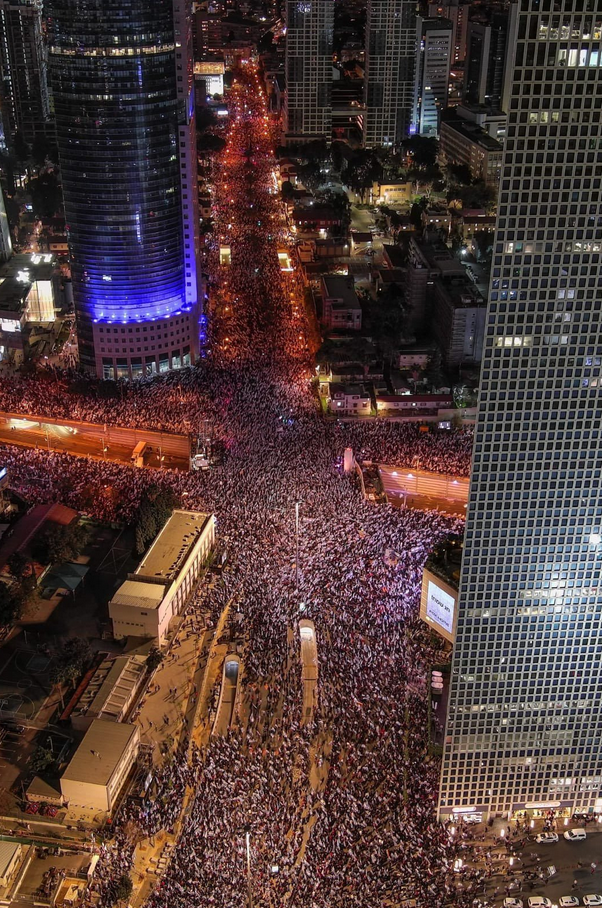
Let’s work our way through them to work out roughly how many people are shown in the image above.
Find The Location
First we need to identify the precise location. Fortunately with public protests this isn’t usually too difficult due to widespread media coverage and documentation. The image above was taken in Tel Aviv, looking along Giv’at HaTahmoshet St.
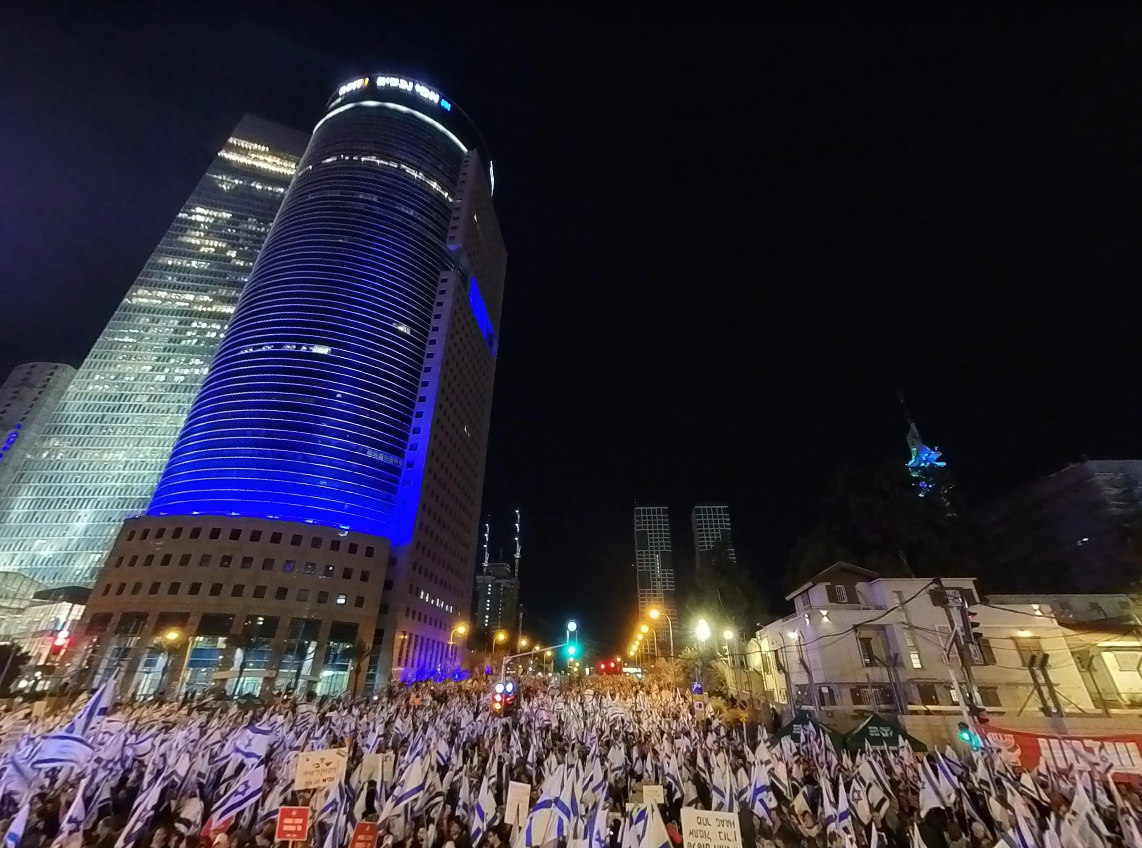
The tall cylindrical building on the left is a government complex. Someone who was at the protest has already uploaded a panoramic photo from this location so verifying that this is the correct place is quite straightforward.
Define The Count Area
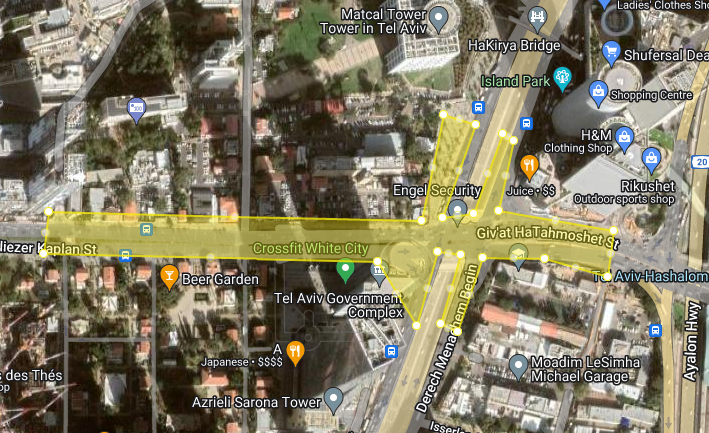
Now we’ve identified the location, the next thing we need to do is to use MapChecking to draw in the area where we can see the crowd in the original photo. We need to try and replicate this area:
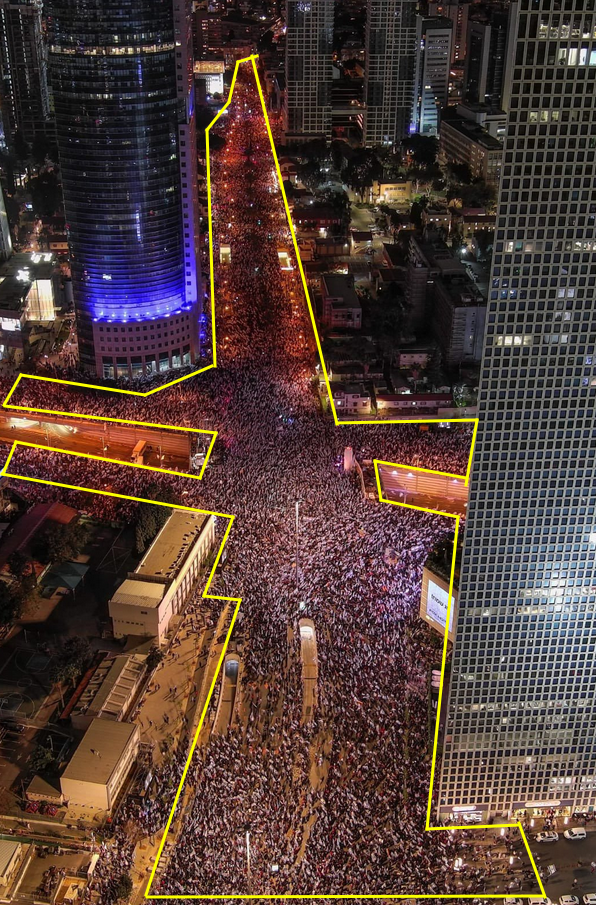
For the sake of accuracy it’s important to remember that there will be people in the crowd that we cannot see in this map due to the obstruction of buildings. For greater accuracy combining several photos from different angles would be better, but for the sake of this tutorial we’ll keep it simple.
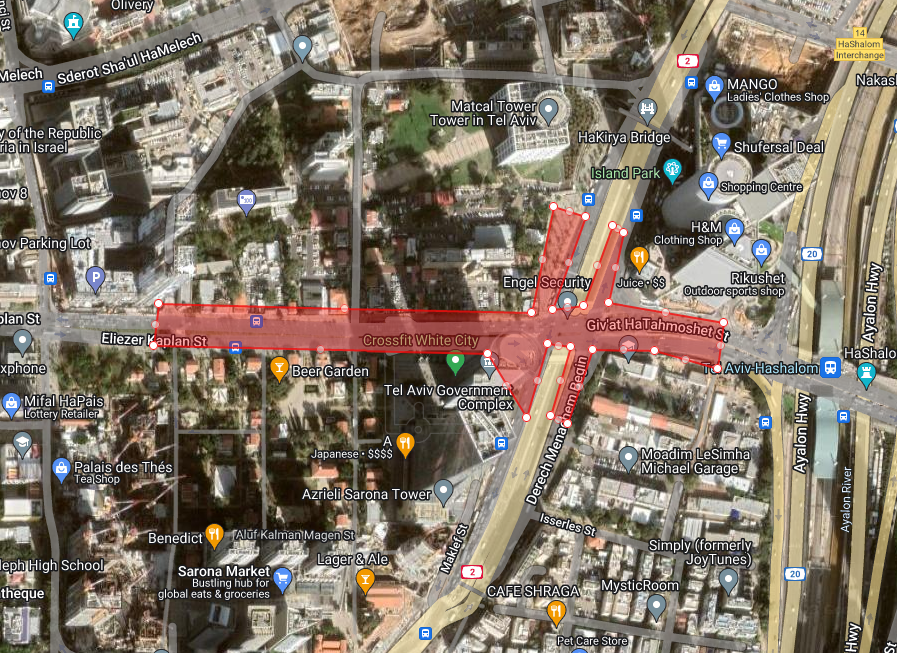
We’ve already identified the location on the map so now we need to replicate this in MapChecking. This is as simple as navigating to the location in the map interface and using the mouse to draw the area where we see the crowd in the photo.
The final shape looks something like this:
Calculate The Crowd Density
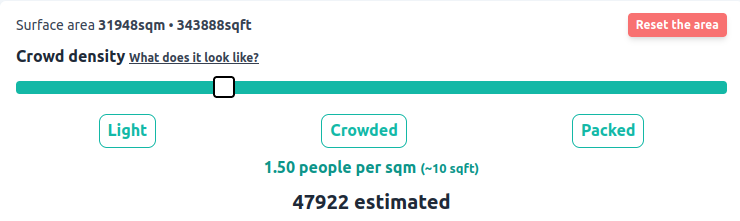
There’s one last step before we can work out roughly how many people are present in the image. We need to know the density of people per square metre so we can know how many are in the search area. MapChecking allows us to adjust the density with a slider:
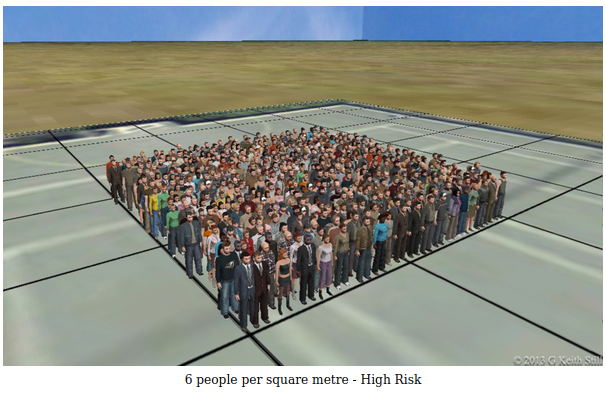
The biggest challenge is how to actually work out the density in the first place. The crowd isn’t evenly spaced so we need to accept that our answer will not be ultra-precise down to a single figure, but usually an approximate value is enough. To help with this the site provides several sample images that show what different crowd densities look like, as documented in this research by Keith Still.
Since we have additional close up footage of the crowd thanks to the Google Photo spheres we can compare them with the baseline images from Keith Still’s research to form a rough idea of the density. Here’s the crowd density in the middle of the protest:
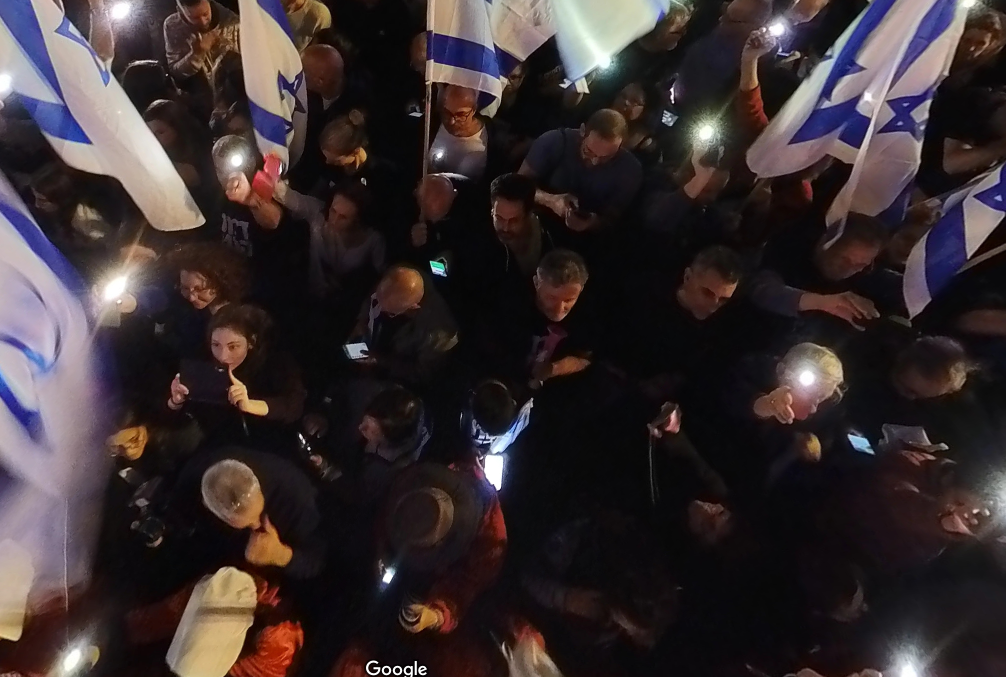
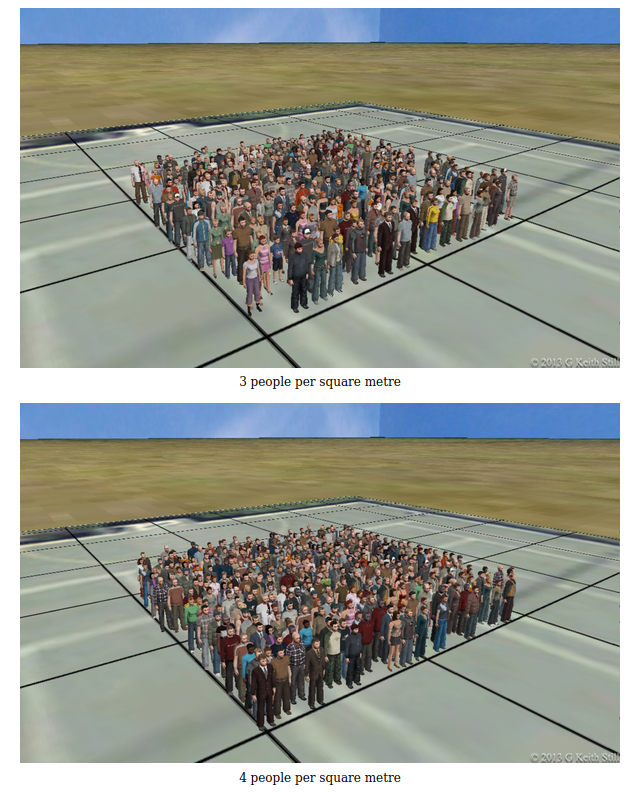
Let’s compare them to the baseline images. The crowd looks quite packed, but people are still able to hold their phones out in front of them and hold flags so they are not so squeezed that they can’t move. It doesn’t look dense enough for 6 people per square metre.
It’s certainly higher than 2 people per square metre though. There isn’t this much space between people in the crowd in the picture:
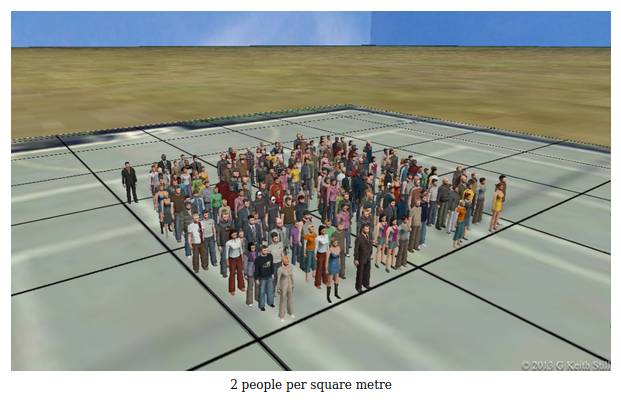
Somewhere between 3-4 people per square metre looks like a better approximation:
To calculate the final number, I’m going to use the figure of 3.5 people per square metre. The crowd is denser in the centre, but more dispersed at the edges. Using the slider to enter the density value tells us how many people are in the area that we drew to match the photo:
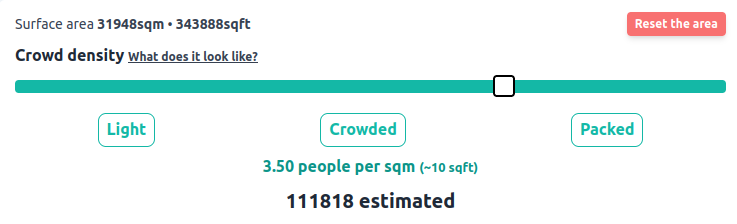
To reflect the slight uncertainty caused by the varied crowd density, it’s helpful to be able to adjust the slider to get an upper and lower range of possible crowd size. At 2.5 people per square metre the crowd size drops to just under 80,000, rising to 140,000 for a density of 4.5 people per square metre. The correct figure will be part way between these two.
If you enjoyed this post, check out my other ones on geolocation here.
Thanks this is super interesting.
In the case of the recent demonstrations in France, taking the example of Paris, how would you go about counting the # of participants in a day? My concern is that crowds move along a certain path and numbers may vary at different times. Unions numbers and police numbers vary greatly.
Two approaches that would help:
1) As many photos of possible of the areas where you are trying to measure.
2) Identify the approximate time of the photos.
In your conclusions you should then be able to show a range of possible crowd sizes but also how they peaked and troughed at different times.
e.g. at 1200 we observed between X and Y number of people in locations A,B and C. By 1900 this had increased to between XX and YY etc.
A more advanced technique for counting moving crowds would be to run video footage fo the crowd and count them with Amazon’s Rekognition People Path tool, but this is more complex to achieve.
https://docs.aws.amazon.com/rekognition/latest/dg/persons.html
Pingback: Counting Crowds In Public Spaces – NixIntel – Library Project XIII: Seven Heavenly Rabbits Edition
Pingback: Counting Crowds In Public Spaces - Whalers Blog
Pingback: Counting Crowds In Public Spaces - Whalers Blog